Every trading strategy looks good until you test it.
I take the strategies people actually trade, test them at scale on real tick data with real costs, and publish whatever's left standing.
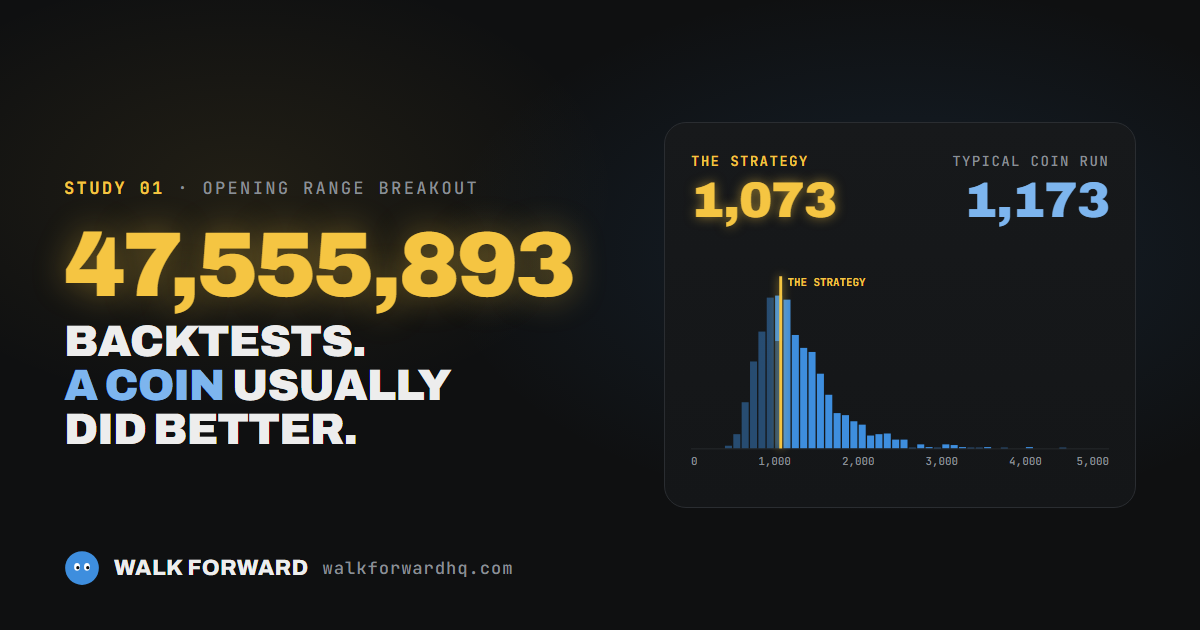
Study 01 · Latest
The Opening Range Breakout vs. a Coin
I tested 12 documented variations of the opening range breakout on seven markets. 1,073 survived. A coin, sent through the same test, usually did better.
I test trading strategies until they break.
Walk Forward is a YouTube channel and a research practice. Each study takes a strategy people really trade and tests it at scale: real tick data, real costs, final years never used to pick anything, and a coin at the finish to check it isn't luck. Then all of it gets published, data included.
Want your own strategy put through the same test? I do that as paid work, and you get the result either way: hello@walkforwardhq.com
Get the next test when it's done
One email when a study is finished, with the result and the data, whether the strategy survives or not. Part two of the ORB study, the entries people say fix it, is one of them.
Free. About one email per study. Unsubscribe in one click.